The Growing Gap in the Numbers

Wendy Dong, Sean MacDonald, and Ian Stewart

On October 7, FiveThirtyEight came out with an election update article titled “AreTrump’s Polls Getting Worse?” which discussed Trump’s decreasing and Clinton’s increasingnumbers in the polls. In FiveThirtyEight’s polls-only model, Clinton’s chances were 55% beforethe first debate and 72% after, as of October 3rd. Likewise, the polls-plus model shows Clinton’schances increasing from 55% to 68% after the debate as of October 3rd, and 76% as ofOctober 7th. Needless to say, there is no denying that the first debate moved voters in Clinton’s favor.


Screen Shot 2016-10-25 at 10.18.32 AM.png


Around two weeks later on October 21, FiveThirtyEight came out with another discussingthe “4 Ways This Election Can End”, three of which involve Clinton winning. Based onFiveThirtyEight’s polls-only model, Clinton currently has a 6.6% lead in the popular vote and a87% probability of winning the Electoral College. In the polls-plus model, numbers went up to84% for Clinton. According to the article, this leaves four possibilities for the outcome of theelection:

1. Trump wins, which includes cases in which he loses the popular vote and winsthe Electoral College
2. Clinton wins, but by a narrow margin in which she wins the Electoral College, buteither loses or only wins the popular vote by 3% points or less
3. Clinton wins the popular vote by 4-6% points (same margins Obama won with in2008 and 2012) and is therefore certain to win the Electoral College
4. A large Clinton victory in which she wins the popular vote by 8% points or moreand is therefore almost guaranteed to win the Electoral College.
An ABC article noted the trend that the candidates are creating some separation andsought to provide some explanations. They claim that the polls are “boosted by broaddisapproval of Donald Trumpon two controversial issues: His treatment of women and hisreluctance to endorse the election’s legitimacy,” Likely voters in a 69-24 vote, disapprovedTrump’s response to questions about his inappropriate behavior regarding women. 63% ofAmericans, including ⅓ of Republicans, believe that Donald Trump has committed sexualassault in the past. The conservatives who were believed that he committed sexual assault, butwere still going to vote for him used a common response. They claimed that they are not asconcerned with what Trump did in the past, but they are thinking more about what he will do aspresident. Along with this, 59% of likely voters think Trump needs to stop calling the election“rigged,” and 65% of likely voters believe that he needs to accept a Clinton victory as legitimate.Some of the recent specific issues surrounding Trump include:
● Trump claimed that he will sue every sexual assault accuser after the election is over.He said this as part of his plan for his first 100 days in office.
● Evan McMullin, who has strong support in Utah, criticized the Republican Party for tryingto force their party ideology on the country when he believes that the interest of thecountry lie elsewhere.
● Donald Trump continues to claim that the Democratic Party is placing people in Trumprallies with the goal of inciting violence.It sounds like people have had enough of Trump claiming that everything is against himand they just want him to focus on the issues our country is facing. If he can switch his focus,maybe he can start to close the gap again.
But is there a possibility this current prediction could change before election day? Recenthistorical precedent suggests no. Vox suggested in an article in Augustthat polls can beconsidered pretty accurate as early as August a few weeks after the conventions (the photobelow is from Robert Erikson and Christopher Wlezienshowing a jump in confidence frombefore to after the convention). In the past 16 elections, the candidate ahead during that Augustperiod has won the popular vote. In August Clinton had the lead, and though polls have shownsome close numbers between then and now, Trump has never held a solid lead over her in thepolls, and her current lead suggests it will be difficult for Trump to come back by election day.
At this time in 2008, Obama had a similar large lead over McCain and not much changedto make the race closer in the last couple weeks. According to the Washington Post, at thispoint only 6.8 percent of voters are undecided, meaning there is only a small margin for thesenumbers to change. Many have already voted, and CNN reportedearly voting shows promisingsigns for Clinton. All of these factors shows that not much is going to change to give Trump asudden boost (unless there is some large national or international event that changes this). Hestands a small chance, and the fivethirtyeight four scenarios should hold steady in these lasttwo weeks with not much change in the polls between now and election day.
Screen Shot 2016-10-25 at 10.20.50 AM.png
Bibliography

What’s Next?American Politics After the 2016 Election

Ben Geyman, Jack Weiss, Dante Moussapour, Chas Burton-Callegari
With three weeks remaining before Election Day, Donald Trump needs a miracle to make his way into office. Following the third and final presidential debate on October 19th , poll data aggregated on Nate Silver’s fivethirtyeight.com shows Donald Trump nursing a 12.6% chance of victory. In a post-debate analysis, Silver notes that while unforeseeable future events or catastrophic polling errors are possible, a shift that would lead to a Trump presidency would be unprecedented and is extremely unlikely for a host of reasons. With the outcome of the 2016 Election looking increasingly certain, we look ahead at how America’s political parties will shift inresponse to this race.
What will happen in the Democratic Party?
Yes, Hillary Clinton won the Democratic primary over Bernie sanders. Yes, she collected more votes than him. But it was not without difficulty. Bernie Sanders’campaign exposed the large population of Democrat voters that lean far left of Hillary. Clinton barely won the primary, and her poll numbers have received a significant bump from voters more invested in preventing Trump’s presidency (Never Trumpmovement) than in supporting her. US News argues that if the Democrats lose the election, “It [the DemocraticParty] has to put a growing economy and job creation at the top of their list ofpriorities, not climate change and abortion rights. The article then argues that the2millennial party may abandon the Democrats if Hillary loses. Earlier this year in a Washington Post article, we are presented with information on the split between supporters of the Democratic party. The article claims that 16% of Americans (a bit less than half of people who identify as Democrats) claim to be Democratic-Independents, an amount that adds up to millions of people.With all evidence pointing towards Clinton becoming our next President, it will be interesting to see how she incorporates issues important to Sanders-supporting Democrats. Clinton has already adopted many of Sanders’ platform points, notably by abandoning support for the TPP and adding a measure on debt-free public university education. However, on October 24th, Sanders issued a statement promising to do his part to prevent Hillary from moving to the center in office. The important policies that emerge from Clinton’s presidency will likely be heavily influenced by how well left-leaning Democratic members of Congress are able to coordinate efforts keep her from moving towards the political center on issues like the federal minimum wage and climate change.
How will the GOP change after this election?
Regardless of the election outcome, Trump’s rise to top of the Republican ticket clearly signals a tide change in the GOP. This is an easy point to make, though nailing down exactly what the change means for the future of the party is more difficult. Speculations on the future of the party have become a subject of media fascination, and we will weigh in below. An NBC special report on the future of the GOP claims that before 2016, the modern Republican Party was “a diverse but sturdy three-legged stool of security hawks, tax cutters and religious conservatives.” While disagreement over the primary values of conservatism pre-dated Trump, the GOP coalition united around the shared interest in winning elections. The forceful emergence of the Tea Party in 2008 exposed some of the differences between the Republican voter base and the party elite, and Trump signals an even larger departure. Trump publicly ignored opposition fromparty leaders, and “violated party orthodoxy on trade, entitlement reform, money in politics, and national security.If Trump loses in November, the GOP will have many possible paths as they realign their key issues for future elections. One possibility is that the Republican Party remains a party of Trump after the election, with immigration and trade reform emerging as lasting leading issues. This populist shift would move the GOP away from the business elite and towards the middle class worker. 
A second possibility is that Trump was simply an anomaly and the GOP establishment will regain control over the party. The party elite could use Trump’s loss as evidence that his important policies were not viable for winning elections, and large donors like the Koch Brothers could replace issues such as trade restrictions, and immigration reforms (deportation, bans on Muslim immigration, etc) with more business-centric issues like reducing taxes and business regulations. Additionally, a significant target of the establishment leadership would be to diversify the party, cited in 2012 as a cause for their defeat. Trump has generally antagonized Hispanic votersand women, though these groups may be important for the GOP in the future. If theestablishment regains control, we may see a rejection of Trump and courtship of newdemographic groups underrepresented in the GOP.
The final, and perhaps most likely outcome, is that nothing changes quickly forthe GOP. Trump will have given a voice to one subset of the party, but the GOP willrecognize that they cannot win elections without forcefully mobilizing all parts of thecoalition. GOP leaders will continue the struggle to overlook differences within theparty in order to prevent losing elections to a Democratic party more different fromany of the internal GOP factions.
Do third parties finally have a place in American Politics?
Never Trump. Never Hillary. In many presidential elections there have been third party candidates looking to buck the two party system and spoil the election forprominent Democratic and Republican candidates. However, in most cases we see these candidates running on platforms that show them as a healthy alternative inpolicy, but this election is different. In this election, we have seen a strong hatred for either candidate, making the third party candidates a vote cast out of spite for manyangered by other options. We knew this going into this election cycle, and have seen Libertarian Party candidate Gary Johnson approach 10% of the popular vote, which would a significant vote share for that party, but more importantly, a significant draw from Clinton and Trump. The charts below demonstrate that the third party candidates have affected the vote share of either candidate already, as the four way race is much closer than the two party polling. This was especially true about a month ago, as Clinton’s lead was pulled within the margin of error because of the voter shareof Johnson and Green Party candidate Jill Stein.
But as we see this election cycle come to an end, it is clear that neither third party willbe in contention (although there is a slim percentage of a win for Gary Johnson in NewMexico) , it is time to reflect on the future of these two parties.7
There are several bright spots for the Libertarian Party going forward.Depending on the results, they will be automatically put on the ballot for the nextelection cycle, saving time and money. This year they are 33 states with the chance togrow to more in the future. Why does this matter? If the next several elections include8less favorable politicians, we could begin to see a larger vote share from theLibertarian Party as they already have a foot in the door of by being on the ballot. Thisis especially true as the idea of ranked choice voting begins to surface in the wake ofunpopular candidates. Maine for example, will be voting on whether to introduceranked choice voting into state legislative elections, a decision that comes as a direct9response to Governor Lepage winning with reflection with less than 40% of thepopular vote. So as we reflect on the future of the Libertarian Party after the 2016election, it is clear that they have a reason to be somewhat optimistic. They will reachnew national prominence, and may prove to steal several down vote elections in thefuture. That being said, it does not seem at all realistic to assume that Libertarian Partyhas enough support to make a valid bid at the White House.
Turning our attention to the Green Party, optimism should decrease. Last week Dr. Noam Chomsky spoke at Bowdoin. During his Q&A forum, a local Bernie supporter,turned Green Party supporter asked, “Can I be hopeful in my voice be heard in thefuture?” (paraphrased) Chomsky was praiseful of the Bernie revolution, and the recent support of the Green Party as an extension, but was weary of the future. His recommendation: greater effort between elections. He believed that the Green Party cannot continue to make little effort until the general election rolls around, and instead make a more established grassroots movement.As the above analysis shows, neither party is prepared to make a bid for the White House anytime soon. But this election has given them a new popular foothold tobuild on, and we can expect to see the Democratic and Republican Party tested indown ballot elections in years to come.

What Makes a Good Poll Good?

What makes a good poll good?

In recent times it has become all too easy to take information found on TV or the internet as fact. We look at poll aggregators like Real Clear Politics, Fivethirtyeight and pollster.com but rarely do we ever question the underlying methodologies of the polls being aggregated. Rarely do we ever question what Rasmussen or Selzer do to get the numbers that we so widely share and discuss. As such we thought it would be a worthwhile exercise to delve into the methodologies of three respected polling agencies in this election to understand better election polling.

Monmouth University

Monmouth University has emerged in recent elections as one of the premier polling institutes in the country. They are one of only 6 pollsters that have garnered an A+ rating on fivethirtyeight’s pollster ratings. So how do they do it? For starters, Monmouth relies on live caller interviews i.e. if you were polled by Monmouth, you would have been called by an actual person asking you questions. The respondents are selected are mixed in their characterisation. In a September poll of 802 people for example, 402 respondents were picked off of a roll of registered voters (even split between landline and cell phone) while the rest of the 400 were picked through a random digit dial(again an even split between landline and cell phone). Notably pollster.com lists the sample as being drawn from all registered voters, showing that poll aggregators might not be completely accurate. Both of the above samples as well as all calling were outsourced to outside organisations.

To make the sample representative, Monmouth weights respondents. In the same September poll mentioned above for example the following table shows the demographics adjusted by weightage. You will notice that they are almost evenly distributed across demographics:


untitled

Notably, Monmouth is careful to note that sampling error might have taken place within certain subgroups

SurveyUSA

As the only poll that does not call cellphones and is ranked A or higher by fivethirtyeight.com, SurveyUSA uses interesting yet effective methodology to construct a reliable poll. In fact, SurveyUSA eliminates bias by not hiring human interviewers at all. They ARE the interviewers. On their website, SurveyUSA points out that other highly rated polls still use outsourced human interviewers to gather data. Inherently, a unknown human caller creates an opportunity for bias. Because the largest polls outsource to call centers, they remain hidden to the quality of the callers they hire. Imagine an interviewer mispronounces a name, speaks with a heavy accent, or even adds his/her own opinion to the question; whether intentional or not, that may change someone’s answer. By interviewing people themselves, the pollsters at SurveyUSA believe they have eliminated bias from respondents. They feel the quality of employee for SurveyUSA is much higher than that of a call center, as their employees are trained to remain impartial, enunciate clearly, and speak slowly. SurveyUSA is owned and operated by journalists who have perfected the language of polling.

Although they do not outsource to call centers, they do purchase random telephone “samples” from companies that expertly randomize. This is a further attempt to limit the amount of bias in their sample. By ensuring a random sample, SurveyUSA can confidently carry out their procedure with not much concern for sampling error. SurveyUSA has created some unique methods of polling, which has propelled them to become one of the premier polls in American politics.


Selzer & Co

FiveThirtyEight called Ann Selzer of Selzer & Co “the best pollster in politics,” but do her polls really deserve that title?

The Bloomberg Politics Poll by Selzer & Co takes a straightforward approach to earn their A+ rating. They used 1002 US adults who are likely votes in this election for their September 26th poll and weighted them based off of age, race, and education. The percentages for these weights were determined by a random sample of 1326 US adults by randomly selecting landlines and cell phones.

Their method for sampling has given evidence to a lack of party bias; it possibly results from Selzers ideology of “Keep your dirty hands off your data” (fivethirtyeight.com). Most polls had a mean-reverted bias towards one party or another. The Selzer & Co pollsters received a 0.0 bias rating for their 37 polls analyzed, meaning they were not bias towards one party or another. The lack of bias is significant since all the other polls that received an A/A+ rating were bias one way or another.

However, the lack of bias might not have played in their favor. Selzer & Co was in the fourth to last for the number of races called correctly of the polls with an A/A+ rating. Also, they predicted that Trump and Clinton would be in a deadlock at 46% each before the first debate and 43% to Trump and 46% to Clinton if the third parties were added. Unfortunately, their model failed to predict the outcome of the first two debates and Trump’s video with Billy Bush.

ABC/ Washington Post

ABC News/Washington Post is another organization that according to FiveThirtyEight has an A+ rating due to its “historical accuracy and methodology of polls.” However ABC also has the lowest percentage of races called correctly at 78%, leaving a 5% gap between its historical accuracy and the historical accuracy of the other A+ pollsters. This indicates that FiveThirtyEight must have put a higher importance on the methodology that ABC uses to conduct their polls.

This methodology was observed in the poll conducted between October 10-13th, a landline and telephone questionnaire of 1,152 adults randomly selected, then categorized as likely or registered voters who answered 23 questions intended to explain voter attitudes.

There were several aspects of the poll that were effective- for example, the poll initiates the questions by asking for how closely the individual is following the election, their likelihood of voting, likelihood of changing their minds and enthusiasm regarding the election as expressed in a range of responses- allowing for non-attitudinal responses as well. It also asks for the individual’s opinion on not only Clinton and Trump but also third party candidates, which beg greater accuracy when determining the spread. It further has used several of these questions in prior polls that shows consistency.

However there were also several issues with the poll. Regarding population outreach only those individuals with landlines are able to respond to the poll which results in a certain demographic polled, despite it being random. The questions in reference to party alignment may not have been problematic had there not been 3 similar style questions in a row, which may seem accusatory to one who is not politically engaged.

Finally the poll revealed the mean-reverted bias that FiveThirtyEight pointed out in their profile of ABC. This was demonstrated with questions that explicitly asked for the appropriateness of Trump’s comments during the debate as well as 5 of the 23 questions regarding womens rights, Bill Clinton, and Trump- not even mentioning Secretary Clinton. The poll doesn’t ask for party ID until the end of the questionnaire.

Ultimately the October 13th poll reflected the typical ABC poll which FiveThirtyEight anticipated with a 3 pt average error (Clinton 47%, Trump 43%).

Conclusion

In sum, analysing the methodologies of these polls has some interesting implications for the way we view and interpret polls. While all the polls have differences in their methodologies and their line of questioning, they all yield similar results and evident from their ratings on fivethirtyeight. On the flip side it is worth noting that looking into the differences in polling methodologies makes one begin to question the accuracy of poll aggregators. While the results of all of the polls are similar, differences in methodologies result in different skews and errors in polls. While errors in different polls might cancel each other out there also exists a risk to reaffirm a certain kind of bias if all the polls were guilty of that kind of bias. Suffice it to say that a simple aggregation like those done on pollster.com or RCP might be good resources to get an idea of where candidates stand but a aggregator like fivethirtyeight which accounts for differing methodologies and results might be more accurate in nature.

http://www.bloomberg.com/politics/articles/2016-09-26/national-poll

http://fivethirtyeight.com/features/selzer/

https://www.monmouth.edu/polling-institute/reports/MonmouthPoll_US_092616/


The Circumstances of Big Landslides

John Ward

This cycle’s election is beginning to be cast as a “landslide” as the polling spread continues to grow. We look at the three biggest landslides in modern election history and how they were reflected in polling.


1964: Johnson vs. Goldwater

The concept of 2016’s Donald Trump as 1964’s Barry Goldwater has generated countless think-pieces throughout this election cycle. Predictably, The Daily Beast, the Atlantic, and The Hill have put forward the idea. But more surprisingly, even the Wall Street Journal editorial page, which once defended Paul Ryan’s Trump endorsement, made the link from Trump to Goldwater’s heavy loss. The parallels are obvious: like Trump, Goldwater “had many opponents in his own party” (Al Jazeera). Goldwater and Trump had similar conventions, in which those who warned against “fear, hate and terror” were “booed” and those suggesting “extremism” cheered (CNN). However, while there are many qualitative similarities between the Trump and Goldwater campaigns, quantitative comparisons are less equal.

untitled


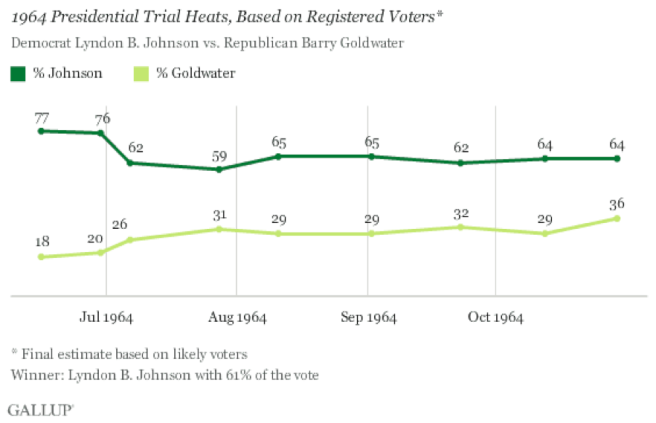
Gallup, due to its age, has some of the best historical polling data. Gallup’s 1964 polling data, as reproduced above, does not show a tight race. Goldwater is only ever barely within 30 points of Johnson—certainly not an underestimate of Goldwater’s failure. In fact, Gallup overestimated the final spread, predicting a spread of 28 percentage points, much larger than the actual margin of victory of 22 percentage points.

untitled


This election cycle’s polling data (from Real Clear Politics, above) stands in stark contrast with that of the 1964 cycle. While Goldwater’s deficit was at best 28 percentage points, Trump’s has been, at worst, only around 10%. At best, Trump has been around even or even above Clinton in the polls. While the Goldwater campaign was easy to declare dead the summer before the election, only now, in mid-October, is a Clinton win nearing certainty, according to FiveThirtyEight’s forecasts.


CNN’s Julian Zelizer points to “polarization of the electorate” as the reason behind Trump’s staying power relative to Goldwater—that there is now a floor on election performance as long as the candidate comes from one of the major parties. In Goldwater’s days, a Republican could lose large numbers of voters to a Democrat. In today’s more polarized electorate, a candidate can only skim a few voters off the other’s more consolidated voter pool.


1972: Nixon vs. McGovern

The 1972 Presidential Election had the second largest voter margin. Nixon managed to grasp 60.7% of the popular vote, while McGovern was only able to scrunge up a measly 37.5%. The goal is to understand this landslide victory for Nixon in hopes to compare and contrast the present day election. In order to do so, one must analyze the circumstances that surrounded the 1972 election.

Untitled.pnguntitled

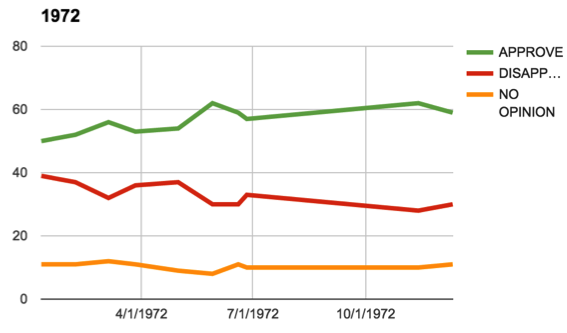
In 1968, Nixon was elected to his first term of presidency. During his first term, Nixon was credited with bettering relations with China and the Soviet Union. Consequently, he had a fairly high approval rating going into the election in 1971. At the end of the year, he sat at an approval rating of roughly 50%. However, this level does not accurately reflect the 1972 landslide result that saw a 23 point margin in favor of Nixon. The spread only became significant during 1972. As one can see, Nixon’s approval in 1972 climbed to new heights. On November 13th, six days after the general election, his approval rating was 62%. Thus, this mirrors Nixon’s enormous victory. Although approval rate is not a perfect comparison to voter turnout, this proves to be a decent indicator.

It is hard to ignore that Nixon’s approval increases steadily from the beginning of July 1972. Even though, it was also increasing throughout the year, his rating does not decrease from this point until after the election. Coincidentally enough, McGovern was nominated that month. Therefore, there is a distinct possibility that Nixon’s landslide victory can be due to McGovern as a candidate, rather to the success of Nixon himself.


An aspect that can have some input into the outcome of the 1972 election is the primaries. From past data, it is evident that Nixon had the full support from his Republican party. He had an overwhelming 86.9% result from the primary popular vote. On the other hand, McGovern actually did not have the highest result from Democrat popular vote. Humphrey received 25.77% while McGovern received 25.35% of the votes. However, McGovern was able to receive a higher delegate count. Thus, he secured the Democratic Primary Nomination.


McGovern was the Democratic Nominee, but many influential Democrats did not support him. They felt as if McGovern’s delegate count did not accurately reflect the wishes of most Democratic voters. There was a “Stop McGovern” campaign that was spearheaded by Georgia Governor Jimmy Carter. This was a crucial factor that lead to his loss as he lacked the full support from his party. This is is supported by his share of the popular vote during his primary campaign. Another example of his lack of support came when he was searching for a running mate. Powerful Democrats such as Senators Ted Kennedy, Walter Mondale, Ed Muskie, Abe Ribicoff, Birch Bayh, and former Vice President Hubert Humphrey all declined to be on his ticket. Therefore, it can said, with some supporting evidence, that the chances were slim from the beginning for a 1972 Democrat President.


It is evident that a lack of support from one’s own party can have a deadly effect in November. Therefore, when one analyzes present day with Donald Trump losing some of the Republican support, is there a chance of a landslide victory in the 2016 election? I would argue under different circumstances, yes. However, due to the lack of a strong alternative, the 2016 election can still have a close margin.

Of course, if a 2016 candidate wants a landslide victory, one can simply break into the other party’s nomination committee headquarters as it seemed to work for Nixon.


Sources:

http://www.gallup.com/poll/110548/gallup-presidential-election-trialheat-trends-19362004.aspx#4

http://historyinpieces.com/research/nixon-approval-ratings


1984: Reagan vs. Mondale

The third highest margin of victory for a presidential election, post WWII, was in 1984, Reagan vs Mondale when Reagan was running for his second term. In order to understand the election of 1984, we first need to look at the climate of the 70’s and the Presidential election of 1980.

In the late 70’s the economy was dealing with low growth; high inflation, interest rates and unemployment; and a persistent energy crisis. Another problem as the Iran hostage crisis, which showed Pres. Carter as an inept leader. A lot of people viewed the handling of the Iran hostage situation as the incompetence held during the Carter administration.

untitled

In the 1980 election, Carter faced stiff opposition from Sen. Ted Kennedy in the primaries and was one of the hardest fought primary race for an incumbent. Many have deemed Hillary Clinton’s Presidential campaigns in ‘08 and ’16 as very similar to the 1980 primary race. On the other side of the ballot, Reagan had a relatively easy campaign except for George H. W. Bush, which some deemed as a possible candidate. The general election was between Reagan and Bush vs Carter and Mondale.

The two campaigns were pretty clear. Reagan ran a campaign based on optimism, reform and giving power back to states. Reagan wanted to restore the nation’s military strength, lowering taxes, and restore power back to the states. Carter ran a campaign mostly on attacking Reagan on his proposals and no real economic reform plans. Carter criticized Reagan for injecting ‘hate and racism’ by proposing words like states right. Many saw this as costing him the election.

In the polls leading up to the Presidency, Reagan was steadily behind Carter in most polls. It wasn’t until early August/September we see Reagan start to do well. It really wasn’t until late November that finally showed Reagan would be leading in the polls. A poll done two weeks before the election of 1,600 people showed the race to be dead even. How could pollsters miss this landslide of an election? It couldn’t be explained by voter turnout, it actually decreased in the 1980 election.

Untitled.png

Ultimately Reagan won 44 States, 496 electoral votes and 50.7% of the popular vote while Carter won 6 States, 49 electoral votes and 41% of the popular vote. A big motivator for a lot of people was when Reagan asked them ‘If they were better off than they were four year ago’.

untitled

After fulfilling a majority of his promises to decrease unemployment and lowering the inflation rate and a strong economic recovery, Reagan was able to Win in a landslide over Mondale, who was Jimmy Carter’s VP. At the time of the election, 55% of people approved of the Reagan administration and people weren’t going to necessarily want to change it. However, many democrats saw this election as one of the final pushes for the party, so you ultimately saw Mondale start with a wide base, but that base shrunk and shrunk as we approached November.

Ultimately, Reagan won 525 electoral votes, 49 States, and 59% of the vote. Compared to Mondale’s 13 electoral votes, 1 State, and 40.6% of the vote. Reagan’s landslide victory was in-part due to his ability to revive the economy and Mondale’s association with the Carter administration.

Untitled.png

The current election of 2016 is unlike any we have seen, with the two most unfavorable people ever running for President. However, there are eerie similarities between the election of 2016 and the election of 1980. The economy is stagnant, there’s low economic growth, and a lot of people having strong negative views towards Pres. Obama and Sec. Clinton’s foreign policy. However, the economic conditions of the 1980’s were a lot worse than they are today.

A lot of polls are coming out indicating Clinton is up by 4+ points, but there are some political pundits out there who claim that polls only look like that because Trump voters have gotten frustrated with the media and refuse to answer polls, even if there anonymous. We are probably looking at a situation in which, come November, the polls are going to start becoming closer and closer. If 2016 results in a Trump Presidency and he fulfills a majority of his promises and the economy is rebounding strong, we might witness another landslide victory for 2020.

Conclusion

One main connection that all of these previous landslides have in common is that they featured an incumbent president. Today’s election is different in that both candidates have never been president. The other common factor is that none of today’s candidates have a high approval rating like Nixon had when he won reelection, which might be an indicator that this year’s election will not feature a landslide win. The markets also seem to indicate that a landslide win will not happen since stock for a republican landslide is selling at 11 cents and stock for a Democratic landslide are selling at 31 cents.


The economy is recovering albeit slowly but the incumbent president Obama does continue to hold a positive approval rating, and current polls show that it is rising. It has been 18 years since we had last seen a landslide and the reason that we might not see one this year is simply the fact that the two parties have become staunchly polarized. During previous landslides the electorate was more fluid and there were many voters who voted across party lines. But today both parts of the electorate have become deeply entrenched and have shown little notion of voting across the aisle. Nate Silver has theorized what a Clinton landslide would look like but even he wrote that his “powers of imagination are limited” when he was writing about what a Clinton landslide would look like indicating that although trump is doing bad in the polls there is no way that he could lose by more than 16 points.


If you are disappointed that you will not get to witness a landslide you might have better luck when looking at Halloween costumes, reports indicate that Trump masks are outselling Hillary masks ‘by a landslide’.

http://fivethirtyeight.com/features/what-a-clinton-landslide-would-look-like/

http://www.nytimes.com/2016/08/24/us/politics/hillary-clinton-donald-trump-polls.html?_r=0

http://www.cnn.com/2016/08/16/politics/donald-trump-hillary-clinton-landslide-loss/

http://nypost.com/2016/10/16/trump-halloween-garb-outselling-clinton-by-a-landslide/

http://www.realclearpolitics.com/epolls/other/president_obama_job_approval-1044.html

https://www.predictit.org/Contract/612/Will-the-Democratic-presidential-nominee-win-at-least-370-electoral-votes-in-2016#data

https://www.predictit.org/Contract/611/Will-the-Republican-presidential-nominee-win-at-least-370-electoral-votes-in-2016#data

Polarization and Elections in America

Hallie Lam, Emily Cohen, Ben Painter, Will Hutchinson

Polarization in American Politics: A Brief Overview

Polarization refers to the “vast and growing gap between liberals and conservatives” (Pew) in the United States. A state of extreme polarization would indicate an environment where the public is divided into two camps who agree on little.  There would also be few “mixed” people who do not always agree with one camp on all issues.  Polarization is a destructive trend in America, as polarization leaves little room for compromise that could produce effective legislation.

Perceived polarization vs. actual polarization

Due to a variety of factors, including the media, polarization of choice vs. opinion, and inefficient congress, Americans tend to “overestimate the mean difference between Democrats’ and Republicans’ attitudes.” (http://themonkeycage.org/2013/02/the-exaggeration-of-political-polarization-in-america/). In other words, we (Americans) tend to think that the general public is more polarized than it actually is.  While polarization is a problem, and a growing one, it is important when talking about polarization not to blow the problem out of proportion.

Untitled.png

As you can observe in the above graphs, even with a growing gap between liberals and conservatives, a large portion of Americans fall into the “mixed” category.

Danger of Polarization

Unfortunately, the people on either extreme of the political spectrum tend to be more involved in the political process from start to finish. This unequal spread of political participation results in elected officials who are more polarized that the general public.

http://www.pewresearch.org/fact-tank/2014/06/12/7-things-to-know-about-polarization-in-america/

Political Realignment in the U.S

When referring to partisanship, it is denoting the relationship between the two major political groups that control our government. The birth of the Republican Party came from antimonarchical views thus advocating for a decentralized government. The party was coined as Jeffersonian Republicans after its founding father Thomas Jefferson, who held a strong antislavery stance in the political realm. Questioning the ethics of slavery in politics forced a fissure in the Democratic party, thus creating Northern and Southern Democrats. Southern Democrats, who were proslavery, identified themselves as “the white man’s party” and used this ideology to convince/force all Southern states to have proslavery sentiments; this realigned the South to become the Democratic Party.

Up until the Civil Rights Movement, the South and remained stable as a one-party region. The upheaval started with the DNC’s choice to back Truman in the 1948 presidential race. A candidate likely to succeed due to his stint as Vice President of FDR, he was representative of upholding the same war effort policies during WWII. Backing Truman meant also backing his pro civil-rights ideologies, which unsettled many Southern Democrats and brought political instability to the previously unified region. The Democratic Party directly challenged the disenfranchisement of people of color, so those who previously identified as Southern Democrat had to realign with the Republican Party in order to maintain state autonomy to filibuster the passing of the Civil Rights Act.

Untitled.pnguntitled

How Media Has Affected Polarization

Technological developments in the late 20th and early 21st centuries have allowed, or even encouraged, increased polarization among Americans. The large number of cable news networks permit viewers to choose where they get their information. The Internet has an even lower barrier of entry: a wordpress account and an opinion are all you need to start a political blog. We can easily pick and choose what we see and who we interact with, creating a negative feedback loop that only reinforces our previously held beliefs.

The Pew Research Center studied political polarization and media habits and found that liberals and conservatives overlap on very few news sources. For example, respondents who defined their views as consistently conservative overwhelmingly said Fox News was their main news source (47%), while consistent liberals were less centralized and included sources like MSNBC (12%) and the New York Times (10%) more often than less liberal respondents. The figure below illustrates the number and range of news sources and shows that many news sources skew highly left or right and therefore have audiences that follow suit.

Untitled.png

The study also examined the role of polarization in social media: 47% of consistently conservative respondents said that the political posts they see on Facebook mostly or always align with their own views, while 44% of consistently liberal respondents said that they have blocked, unfriended, or unfollowed someone because they disagreed with what that person posted about politics. These statistics further demonstrate how political polarization is exacerbated by the myriad options and freedoms that have come with changes in mass and social media.

How Polarization and Partisanship Will Shape the Future of Politics

The Republican party is in free fall right now. Trump has lost support of long term Republicans among others, and has spoken out against the party in recent weeks. The Democrats on the other hand have a well-established candidate in Hillary, who in turn boasts a favorability rate of 42%. Because of the two weak candidates, voters are showing more anti-republican and anti-democratic support rather than support for the candidates themselves. This anti-party rhetoric shows the true polarization of the nation.

Theoretically, if the nation wants to vote party over person in the presidential elections from now on, because candidates aren’t favorable enough, what does that mean for the future of political parties and polarization in American politics? Currently, the bulk of the Republican Party is made up of upper class and white evangelicals typically from the South and Midwest. Democrats on the other hand, are typically made up of minorities and young educated populations. Party affiliation is dramatically changing and will continue to shift towards these groups.

But how will this shape the future of parties? The GOP has a very narrow constituency and it will prove to be damaging if Hillary wins, meaning there will be 12 straight years of a Democrat president. FWD.us (http://www.fwd.us/gopfuture ) used census and voter data to show the trends of past and future elections to display what the electoral college will look like if the demographics of each party do not change.

Untitled.pngUntitled.png


These may only be forecasts, but it is clear that the GOP is in danger and a major party realignment is in store within the next election cycle and will shape the future of American politics and partisanship.

http://www.pbs.org/wnet/jimcrow/stories_org_democratic.html

http://www.nytimes.com/2014/12/05/upshot/demise-of-the-southern-democrat-is-now-nearly-compete.html?_r=0

http://assets.pewresearch.org/wp-content/uploads/sites/12/2014/06/polarization505px_30fps.gif

http://assets.pewresearch.org/wp-content/uploads/sites/12/2014/06/polarization505px_30fps.gif

http://www.journalism.org/2014/10/21/political-polarization-media-habits/

http://www.fwd.us/gopfuture

http://www.people-press.org/2015/04/07/a-deep-dive-into-party-affiliation/


Fact-Checking and Presidential Elections

By: Kyle Morrison, Kelsey Bumgardner, Molly Foley, and Andreas Tockens

The second presidential debate occurred last Sunday. Both candidates vehemently attacked and defended themselves. This debate seemed to ask the following questions: What is the truth? Do we live in a post-truth era?

Do we live in a post-truth era?

Many newspapers state that we are in a post-truth era.1,2,3 People who state that we live in a post-truth era mention that people no longer care about politicians lying. For example, one study shows that “when non-political speakers are exposed to fact-checking as making an inaccurate statement, people have less favorable attitudes toward them. However, when politicians make statements that are corrected by fact-checking, there is no significant change in favorability.” 4


Untitled.png


The politician’s favorability decreased a lot less in comparison to the non-political speaker. But, favorable attitudes might be driven by party affiliation. This study suggests that people do not care about politicians lying; however, fact-checking has increased in popularity.

The Trend of Fact-Checking

Fact-checking exploded in 2012 and has continued to increase. Websites dedicated to fact-checking, such as PolitiFact and FactChecking.org, have increased in popularity. PolitiFact received 3.5 million views 24 hours after the first presidential debate.5 Fact-checking stories increased by fifty percent from 2004 to 2008 and by 300 percent from 2008 to 2012.1 Furthermore, a survey by Monmouth University states that 60 percent of voters believe that the moderators should check candidates’ statements.6 Some might state that voters say they care about the truth when in practice few people seek out the truth (social desirability bias). However, the overwhelming evidence points to the fact that more people are paying attention to fact-checking. So, what is the effect of more people paying attention to fact-checking? Or is there no effect because we are too partisan? Before answering these questions we must consider how information is processed.

Processing Information 7

Researchers state that there is systemic processing and heuristic processing. Systemic processing is consciously evaluating and understanding a piece of information and whether or not that piece of information is true. Systematic processing is about considering multiple high quality arguments. Heuristic processing is about having a cognitive shortcut. If a candidate is democratic then you will vote for that candidate. In terms of evaluating the truth, the source of information and attractiveness of the truth will be considered.

Why is fact-checking powerful?

Fact-checking is very persuasive because multiple rational arguments are presented with what the candidate has said. Fact-checking generally uses data that anyone can access, so it is more powerful than a simple word against word argument. Generally, the source is more trustworthy. FactCheck.org is more trustworthy than an advertisement that has been paid by the candidate. Since fact checking is so powerful, it is also very dangerous. Television uses its own biases to fact check (MSNBC is more liberal and FOX is more conservative). Also, fact-checks have a negativity bias: fact-checks that state that the candidate was inaccurate will be more powerful and looked at more often than fact-checks that states that the candidate is telling the truth. Since fact checks are becoming extremely popular in the media, everyone is saturated with negativity. In particular, most people are saturated with negativity of the candidate who they are not voting for. FOX is more conservative and will do fact-checks on negative aspects of Clinton while MSNBC will do negative fact checks on Trump. If one gets news information from social media, the same results occur. For example, Facebook’s newsfeed delivers content that is similar to what you have liked and shared in the past.8 Your friends are also likely to have the same views as you. Therefore, the newsfeed acts as a confirmation bias or a place that simply confirms your already held beliefs. FactCheck.org is better than these two because they have negative reporting on both candidates, with a more thorough analysis and description of where they found their sources. However, FactCheck.org is not perfect and cannot be taken as the ultimate truth.

How does fact-checking influence individuals? 7

During the second presidential debate, Hilary Clinton stated that people should go and fact-check Donald Trump. She clearly believes that fact-checking influences ones vote. In a study looking at the influence of fact-checking on citizens, researchers found that citizens’ levels of sophistication about politics, individuals’ tolerance toward negative campaign messages, and people’s partisan attachments influenced people’s attitudes towards a fact-check.4 Researchers looked at the U.S. senate race in Ohio (2012) between Sherrod Brown (democrat) and Josh Mandel (republican) and asked survey questions to 452 people. Researchers found that individuals who had a small tolerance for negativity were more likely to view negative ads critically and more readily accepted a fact-check. Politically knowledgeable individuals were more hesitant to accept a negative ad and much more likely to engage in systematic processing. This means that politically knowledgeable individuals were more likely to distinguish if a fact-check was biased or not as well as if the attack ad was biased or not. Republicans are less likely than democrats to accept a fact-check that states a republican was wrong. Finally, fact-checks that challenged the negative advertisement were more powerful than fact-checks that validated claims in a negative advertisement. Overall, fact-checks were found to influence individuals’ perceptions of a negative advertisement. This in turn could influence an individual’s vote.

Conclusion:

We do not live in a post-truth era given the ubiquitous nature of fact-checking and its influence on individuals. The problem may be that we seek one biased source and not an aggregate (we go to FOX or MSNBC or social media). When we solely rely on heuristic processing and not systematic processing, we become partisans who cannot change, and we end up with two candidates who have very low favorability ratings. Let’s start to fact-check and engage in systematic processing so that we can hold our politicians accountable.

Sources:

1 https://www.washingtonpost.com/posteverything/wp/2016/06/16/why-the-post-truth-political-era-might-be-around-for-a-while/?utm_term=.3faf3864e475

 2 http://www.newyorker.com/magazine/2016/03/21/the-internet-of-us-and-the-end-of-facts?mbid=social_twitter

3 http://www.nytimes.com/2011/12/23/opinion/krugman-the-post-truth-campaign.html?_r=0

 4 https://www.americanpressinstitute.org/fact-checking-project/new-research-on-political-fact-checking-growing-and-influential-but-partisanship-is-a-factor/.

5 https://www.washingtonpost.com/opinions/fact-check-this-is-not-really-a-post-fact-election/2016/10/07/7ef5f8fa-85c0-11e6-92c2-14b64f3d453f_story.html?utm_term=.249139b82a56

6 http://www.monmouth.edu/polling-institute/reports/MonmouthPoll_US_092616/

7  http://dx.doi.org/10.1080/10584609.2014.914613

8 http://www.poynter.org/2016/can-fact-checkers-break-into-facebooks-echo-chambers/408610/


VP Impact: Up For Debate

Ann Basu, Liam Finnerty, Sophie Meyers, and Brian Thompson

How much do VP candidates influence the election?


According to Christopher Devine and Kyle Kopko, authors of the book The VP Advantage, there is none. Though it’s often assumed that vice presidential candidates can add votes in their home states, and subsequently possibly swing elections, that’s essentially untrue. Devine and Kopko analyzed 128 years of state-level election return data (from 1884-2012) and individualized survey responses from 1952-2008, and found that while the geographic advantage of presidential candidates to affect their home states (by 3 to 7 percentage points0 exists, there is no equivalent advantage for vice presidential candidates. As such, we shouldn’t expect any significant bump in polling from either Kaine’s or Pence’s home states of Virginia and Indiana.

That being said, while the specific locals of each VP candidate might not be impacted, that’s not to say the VP pick is purely nominal. The 2016 election is unlike any America has ever seen: a career politician is running against a candidate who has never before held political office, and the two are perhaps the least popular choices in recent history. For example, take this year’s Republican ticket: Donald Trump is an incredibly atypical candidate with no political experience. Oft-criticized by both sides, Trump manages to ostracize even his own party. The Trump campaign looks to their VP candidate Mike Pence Governor of Indiana and career politician, to change that. Pence is Trump’s “bridge to the GOP”, and will likely garner Trump some support among Republicans who are wary of his lack of experience. Though perhaps not geographically, there are still plenty of ways the VP nominee can impact the election and, ultimately, the presidency. As a result, the vice presidential candidates are more important than ever before. Pence and Kaine, both career politicians, are more likely to dig into the issues and highlight their clear policy differences than Clinton and Trump did in last week’s chaotic first debate.

Candidates reportedly spend exorbitant amount of time and money in the search for running mates. They often view their pick as a matter of strategy; short lists often consist of individuals who will be able to help candidates pick up some ground either in swing states or among particular groups of voters who may otherwise be wavering in their support. In 2008, Republican presidential candidate John McCain reportedly chose Governor Sarah Palin of Alaska to appeal to both social conservative and disaffected women voters who previously supported Hillary Clinton. This election has proven no different. Many view Trump’s choice of Pence as a connection to the candidate’s own party. In his political career, Pence has often supported conservative causes – religious freedom, anti-abortion legislation, etc. – and is seen as a sage choice for a Republican running mate that may render Trump acceptable for Republican voters. Similarly, Clinton’s choice of Virginia Senator Tim Kaine – a moderate Democrat from a swing state who has historically fought for rights of minority communities – is strategic in its own right.


What’s at stake in the VP debate?

Logically, the vice presidential debates would give candidates the opportunity to put their influence into effect. With the spotlight on them, the VP picks can influence those undecided voters who may be swayed by what they have to say. However, studies on previous presidential elections sho that vice presidential debates do not have a significant effect on the overall outcomes of presidential elections. in his book “Do Campaigns Matter?” Thomas Holbrook conducted a study of past presidential elections to examine the effects of vice presidential debates through polling. He found that in both the 1984 and 1988 presidential elections, polling numbers one week after the debate had been restored to the pre-debate levels. This sort of ‘short-run’ bump in polls following vice presidential debates is typical and often does not last.

Screen Shot 2016-10-06 at 10.47.48 AM.png

Screen Shot 2016-10-06 at 10.48.10 AM.png

It will be interesting to see how the Vice Presidential debate impacts the favorability ratings of each VP candidate. On October 4th, the day of the debate, Huffington Post reported Mike Pence having “a net positive rating of 6 percent, with a 37/31 percent favorable/unfavorable score” and Tim Kaine with “a net favorable rating of just over 1 percent.” Both candidates have a significant portion of voters, 31.5% for Pence and 31.7% for Kaine, reported as undecided. These Huffington Post graphs illustrate how much less volatile vice presidential candidates favorability is compared to the presidential candidates. In this election, and associated media circus, it will be interesting to see if post-debate shifts occur after the spotlight is put exclusively on Pence and Kaine.


Was this year’s VP debate any different?

Immediate reactions to the debate seem to hold that Mike Pence outperformed Kaine. He appeared more respectful and less scripted than Kaine, who came off as abrasive and mildly smug. While it is too early to see the results of scientific polling, a CNN poll conducted shortly after the debate – notably with a Democrat-lenaing sample – had Pence ahead of Kaine by 6 points in debate performance. Only time will tell how the VPs performance may affect the polling success of their ticket.


Social Desirability and its Possible Effects on the 2016 Presidential Election

Lexi Gray, Lauren O’Shea, Adam Cohen, Kyle Wolfe

Social desirability bias has long existed, both in the United States and in other countries. People are always afraid of being judged for choices not deemed socially acceptable, even in a phone poll by someone they have never and will never meet.

Historically, this effect has badly thrown off polls. For instance, in the United States, social desirability bias against African-American candidates has historically been prevalent, although there is some debate on whether or not there is still an effect anymore. For instance, Tom Bradley, an African-American mayor of Los Angeles, ran against a white candidate, George Deukmejian, for the governorship of California. Although Bradley lead significantly in polls before the election and exit polling, to the point where newspapers declared him the winner, he narrowly lost. Social desirability bias explains this effect perfectly, as many poll respondents could have felt that they would be judged for voting against a black candidate, even if they planned to do so.

Social desirability bias is not a uniquely American phenomenon, nor is it necessarily tied to issues of identity, such as race or gender. For instance, Brexit polling showed strong effects of social desirability bias.

Picture1.png

(http://blogs.lse.ac.uk/brexit/2016/02/22/polls-apart-why-we-need-to-treat-all-eu-referendum-polling-with-caution/)

In the above graph, we can see that Remain is much more heavily favored in telephone polls than in online polls. Social desirability bias affects telephone polls more than online polls because the feeling of being judged by an interviewer is greater than when filling out a form online. In the case of Brexit, many interviewees could have not wanted to reveal their support for leaving the E.U., a very controversial decision.

Social desirability bias occurs when an individual answers a poll, survey, or other mechanism of public feedback with answers he or she perceive to be socially desirable regardless of his or her own true opinion. This bias can happen quite often around sensitive questions regarding race, gender, gay marriage, and other demographics. Rather than admit personal beliefs and biases regarding these sensitive topics, some people may resort to giving answers that appease the individuals asking them. The importance of environment also plays a key role in determining the potential for social desirability bias within a poll; for example, in a classroom setting at Bowdoin College, a student might shy away from admitting to support Donald Trump due to the college’s reputation as a liberal school.  In this instance, by not stating their true beliefs, the student instead appears to favor Hillary Clinton, thus giving the optimal social response but not the true view he or she holds.

Social desirability bias is also more frequented in polls that involve personal conversations with a pollster or contain limited anonymity in the structure of the polling. In these cases, because an individual must take ownership of his or her response, he or she may give an answer they believe the pollster wishes due to feared social judgment and perceived ignorance. Social desirability bias can further impact a poll if the interviewer’s demographic is being questioned within the poll; for example, if a woman asks an individual how they feel about the idea of a woman acting as President of the United States, the respondent may answer that they feel positive about this topic even though, in reality, they may oppose the idea. Therefore, the subject of the poll, the environment in which the poll is conducted, the amount of interpersonal contact involved in the polling, and certain qualities and characteristics of the interviewer can all contribute to the social desirability bias present within a poll.


Are Voters Afraid to Openly Support Trump?

Donald Trump has been doubted by many at every stage of the 2016 presidential election. Experts predicted that he would have no chance in the Republican primary, running against established politicians like Jeb Bush, Ted Cruz, and Marco Rubio.  On July 1, 2015 the experts were right.  Trump was polling in 7th place.  However, by the end of the month Trump was in first place, and went on to secure the nomination by a sizable margin.  Trump is clearly a popular candidate and has certainly posed a threat to Clinton in the general election.  If he has such a large base of support, why are people continually doubting the legitimacy of his shot at winning?  How many people you know openly support Donald Trump?  The answer could be none, or could be a lot, either way it is likely less than the actual amount of Trump supporters that you know.  The reason for the disparity between perception and election results for Trump campaign is the effect that social desirability has in a person’s response to political surveys.  This is especially relevant to Trump given the polarization his platform evokes and the stigma surrounding his supporters.

According to RealClearPolitics, Trump’s favorability rating is currently 38% (RCP 2016).  He has a history of making derogatory statements about women, minorities, and people with disabilities.  As a result, to some people a vote for Trump has come to represent racism, sexism, and general ignorance.  In more liberal communities across the country, like Bowdoin, the backlash against Trump supporters is significant.  The impact of the hesitancy voters show in revealing their true intentions is concerning, specifically in the context of the accuracy of polls.  Apart from the difficulty in obtaining a bias-free random sample of representative voters, if people are not honest, the polls are worthless.  Trump’s true chances could be severely understated if a significant portion of his likely voters are truthfully responding to surveys due to fears of being judged.

In a NYT opinion piece, Thomas Edsall agrees that certain polls may under-represent Trump supporters because, “many voters are reluctant to admit to a live interviewer that they back a candidate who has adopted such divisive positions” (NYT 2016).  There is evidence that more people agree with Trump’s views than polls or public perception suggest.  Based on a American National Election Studies, favoritism of a white-centric America has support across all political parties.Picture1.png

This poll suggests that there is a strong basis of likely support for Trump that may not be captured through in person polling.  The question is how to capture true voter sentiment in order to more accurately predict elections.  Not surprisingly, Edsall notes that Trump does better in online polls, where there is little or no risk of external judgment, than in person-led interviews. Are online polls more trustworthy?  While online polls can mirror the privacy of election day, they are not without their own issues of uncertainty.  A strength of online polling is its convenience for responders.  This can also pose an issue.  The people who are going to fill out an online survey may not be the same people to show up to vote on election day.  Voting takes an extra level of effort that online polls do not present.  It is important to consider the effect that social desirability may be having on Trump’s polling results.  Understanding the risks of all types of polling will make it easier to understand the strengths and limitations of each survey.


Is the United States Actually Ready for a Female President?

Are we currently overestimating support for Hillary Clinton or is the social desirability  effect a thing of the past? The literature is conflicting. Some studies state that there was never a social desirability effect toward women running for office, and other studies claim that there was and continues to be a large effect that may impact the 2016 election. We took a look at biases against female candidates, how the office the candidate is running for can affect these biases, and finally how these biases may affect Hillary Clinton.

Many people express their support for female candidates publicly; however, this does not mean that they vote for these candidates when they enter the voting booth. A study conducted by Matthew Streb and colleagues in 2008 investigated social desirability effects and support for female presidential candidates. The study used a list method to determine subjects’ true feelings about a female becoming president. The study found that 26% of participants would be angered by a female president; this is a stark contrast to the 91% of people who claimed on that they would vote for a qualified female candidate. These results suggest a social desirability bias. People may outwardly support female candidates because they believe it is socially unacceptable to express their true opinion. This false reporting can cause the polls to overestimate the support for female candidates (Steb, 2008).

In order for a social desirability effect to exist, there must be biases present that are perceived as socially unacceptable. Do voters actually view male and female presidential candidates differently solely based on gender? A study conducted by Jessie Smith in 2007 sought to answer this question. Participants in the study were provided with one of three identical resumés, with the only difference being that one had a female name, Karen, one had a male name, Brian, and the other had a gender neutral name, Terry. Participants rated their impression of the candidate based on factors including presidential potential, skill level, and accomplishments. The resumé that was marked with the name Brian was aligned with more positive statements than the resumé that was marked with the name Karen. Participants viewed Brian as having better presidential potential and thought he did better in his career when compared to Karen (Smith, 2007). Most people would not openly say that, all being equal, a man would do a better job than a woman, but it appears that many people may actually feel this way.

Picture1.png

Table from (Smith, 2007)

There have been many studies conducted that deny the existence of a social desirability effect for female candidates; however, these studies are referencing women running for positions that are not the President of the United States. Is it possible that voters are accepting of a female senator or governor, but not of a female president? Smith’s study found that when comparing subjects’ views on presidential candidates to views on senatorial candidates, there is a marked difference. The study showed that participants demonstrated no statistically significant biases toward female senatorial candidates, indicating that gender biases may be restricted to the presidential office (Smith, 2007).

In 2000, Clinton won the New York senatorial election against Rick Lazio by a larger margin than expected. This is the opposite of what we would expect had the social desirability effect been present. This was the case for her 2006 election as well. Although there has been no social desirability effect demonstrated in Clinton’s past election cycles, this does not mean that she will not experience a social desirability effect in the 2016 presidential election.  Until now, we have never had a female candidate become the nominee for a major party in the United States, so we do not have historical data about the social desirability effect as it relates to women running for president. The data we do have suggests that voters may not have biases against female candidates in general, but that there are biases specifically against female presidential candidates. This may create a social desirability effect where one was not previously seen and would result in an overestimation of support for Clinton.


How Can We Eliminate the Social Desirability Effect?

Rather than predict the outcome of this election, we wanted to conclude with three methods that best eliminate social desirability bias from election polls and surveys. The first is “list ranking,” which was used in the Streb study, “Social Desirability Effects and Support for a Female American President.” List ranking increases the anonymity in responses by eliminating the ownership as to which listed items a respondent either agreed or disagreed with. However, by implementing both a control and an experimental group in the polling, a researcher is able to conclude that mean differences between two groups can be attributed to the additional listed item given to an experimental group. For the Streb study, this additional item was whether or not having a female president would upset the participant. Another technique to decrease social desirability bias in polling is to make the survey as impersonal as possible. This can be done through polling online. If a researcher chooses this method, he or she must be aware of the addition of response and selection biases that can arise from online polls. The last method our group wished to mention was creating polls that are as similar to the actual voting process as possible. This can be done by creating mock ballots with a personal space designated for individuals to cast votes. By mimicking the decreased human interaction of the polling and additional privacy available to the respondent, a pollster may best be able to capture the voting that will occur on election day.


SOURCES:


Smith, Jessie. “No Place for a Woman: Evidence for Gender Bias in Evaluations of Presidential Candidates.”BASIC AND APPLIED SOCIAL PSYCHOLOGY, 29(3), 225–233 Copyright # 2007, Lawrence Erlbaum Associates, Inc.


Streb, Matthew. Burrell, Barbara. Frederick, Brian. Genovese, Michael. “Social Desirability Effects and Support for a Female American President.” Public Opinion Quarterly, Vol. 72, No. 1 2008, pp. 76–89.


Authors, By LSE. “Polls Apart: Why We Need to Treat All EU Referendum Polling with Caution.” LSE BREXIT. February 22, 2016. Accessed October 04, 2016. http://blogs.lse.ac.uk/brexit/2016/02/22/polls-apart-why-we-need-to-treat-all-eu-referendum-polling-with-caution/.


Edsall, Thomas. “How Many People Support Trump but Don’t Want to Admit It?”.  New York Times.  May 11, 2016. http://www.nytimes.com/2016/05/11/opinion/campaign-stops/how-many-people-support-trump-but-dont-want-to-admit-it.html?_r=1


RealClearPolitics, Trump Election Poll http://www.realclearpolitics.com/epolls/other/trump_favorableunfavorable-5493.html


The Impact of the First Presidential Debate

By Sophia Ardell, Wendy Dong, Sean MacDonald, and Ian Stewart

1 Pre-Debate Discussion:

As always, the lead up to the first presidential debate is full of tension and uncertainty. The usual volatility of Trump combined with the pneumonia-ridden Clinton is already provoking discussion, and forecasters are calling for the possibility of the most viewed debate ever, surpassing the previous high of 80 million views in 1980 when Jimmy Carter butted heads with Ronald Reagan. Going into the debate, Bloomberg Politics has the Democratic and Republican candidates at 46% each. When the third party candidates are factored in, the race remains tight:


screen-shot-2016-09-29-at-11-07-40-am


Trump’s 2% lead is well within the +/-3.1% margin of error. This election stands out from previous seasons as voters on both sides show a degree of unwavering commitment to their candidate that previously has been unobserved. Additionally, both Trump and Clinton have unfavorability ratings of 56% . Both of these unprecedented factors cast doubt on whether previously successful political forecasting models can be trusted in these elections.


Moving into this debate, it is projected that Hillary’s experience and composure will overshadow Trump’s passionate, impulsive approach:

Screen Shot 2016-09-29 at 11.08.50 AM.png

Trump’s ability to maintain a presidential appearance for 90 minutes has been questioned across media platforms . However, both candidates has a host of attributes that the public is dissatisfied with, and it is worth noting which are addressed. For example, voters are concerned with Clinton’s use of a private email server, and there has been lots of frustrated media coverage on her not disclosing her recent illness sooner. One of Trump’s biggest concerns surrounds the legitimacy of his charitable foundation and his real-estate program.

2 Post-Debate Discussion on the Role of Media and Polls on

Undecided Voters:

So who won? Despite the record-high viewership of the debate, many turned to the media and polls for the answer. In a CNN debate poll that asked “Regardless of which candidate you happen to support, who do you think did the best job in the debate – Hillary Clinton or Donald Trump?” 62% said Clinton and 27% said Trump. This poll marks a definitive win for Clinton, and though there have been some disagreements to the answer ( Fox News declared Trump the winner, though admittedly said the media consensus was that Clinton won ), does it really matter who “won”? Obviously, debate performance isn’t the only factor when determining the election, nor is it always a significant factor. In the same CNN poll in 2004, results showed Kerry dominating Bush every debate, in some by almost 20%.

According to the Huffington Post, 91% of voters were already decided going into the debate, and though voters can change their minds, this election has seen candidate support that is staunch and unchanging ( with Trump remarking he could shoot someone and still keep his support ). But many of those undecided may be agnostic voters, falling into Converse’s “no issue content” group. It is likely that these voters did not care enough to watch the debate, and in that respect the reported answer to who won the debate matters. These voters (who may not vote so it is questionable how significant their opinion is) will still open Facebook or watch the news and see who the media declares the winner. For this election especially, it doesn’t matter who watches or what most of the watchers say, it matters who the media declares the winner and what immediate polls state.

Clinton, who enjoyed an early on lead in the polls, needed this “win” to help her numbers, which recently have been coming close to Trump’s, as she loses her margin. Therefore, while the debate won’t change the minds of loyal Trump supporters, it should cause some of the previously undecided voters to choose Clinton as election day nears, which can help Clinton get a boost in the polls she needs.

Screen Shot 2016-09-29 at 11.12.07 AM.png

2.a How the Media Can Influence Voter Opinion

The 2018 election has been anything but calm, and the first Clinton vs. Trump presidential debate only added to the vast amount of media coverage. The debate was predicted by experts and the media alike to be the most watched debate in history. In the days leading up to the debate, popular news outlets were hyping up the importance of the showdown. U.S. News called it the “Clash of the Century”, while CNN told viewers to expect an “Olympic Battle of Wits”. However, according to a piece published in the Washington Post’s Monkey Cage titled Here are 5 keys to watching Monday night’s debate between Clinton and Trump, it is not so much the media that leads up to a debate that matters, but the media coverage after.

In a 2004 study conducted by Arizona State Universit y, researchers divided the subjects in three groups. One group only watched footage of the third presidential debate in 2004, the second watched the debate footage and 20 minutes of post-debate commentary on NBC, and the last group watched the debate footage and had 20 minutes to read CNN’s analysis of the debate.

So who did people think won the debate, Kerry or Bush? Turns out, it depended on whether or not subjects watched the news. Those who only watched the debate footage tended to think Kerry won. However, those who watched the debate and read the commentary on CNN tended to think that Kerry won, while those who watched the commentary on NBC thought Bush won. This discrepancy in opinions shows that people’s attitudes are in fact susceptible to the media’s interpretations, since the media will often change a candidate’s message.

However, as we have learned in class, no study is perfect. The sample size for each group was fairly small (as show in the graph), and there could have been possible selection bias based on how the study acquired its subjects. In addition, the wording of a question is very important and can “frame” a person to answer it a certain way (framing effect).However, all in all, it is still important be aware and think about how the media coverage of the first Clinton vs. Trump debate may affect voter opinions.

Screen Shot 2016-09-29 at 11.13.14 AM.png

3 Conclusion

As we have discussed, there remains few undecided voters this election season, and their opinion very likely hinges on the media coverage of the first presidential debate. Because of the general consensus of Clinton’s victory in the press and publicized polls, we predict an increase in support for Clinton that is beyond the margin of error, while Trump’s support stays stagnant or decreases slightly.

A Look Back at Debates and Polling

Charles Burgess, Jordan Moskowitz, Jack Ward, and Westly Garcia


The first presidential debate of the 2016 election cycle has come and gone, reaching record numbers for viewership across a wider number of platforms than ever before. Thought pieces now cover print and screen with questions of how the candidates did, and, more importantly, how their performances will affect voters. But maybe it is better to ask: do debates have much of an effect on polling? A comprehensive, hundred-year study is outside the scope of this post, but we attempt to provide a shallow look at how debates have affected polling in the last few election cycles: Jordan covering this year’s first debate between Clinton and Trump, Charles with debates from the 2012 Obama-Romney race, and Jack with 2008’s Obama-McCain race.


The First Debate of 2016


The debate was pretty standard. It was Trump being Trump and Clinton being Clinton. I don’t think the candidates disenfranchised any voters, but not many were won either. Trump dominated the first third of the debate as the questions were on issues such as jobs, taxes and regulations. Then the debate was able to take a turn as Lester Holt asked some very biased questions against Trump such as on his tax returns, the whole birther movement, and beauty pageants while avoiding questions directed towards Clinton on her email scandal, Benghazi, and her Clinton Foundation. I think that this election will be decided on what issues the American people decide that they care about whether it be trade, jobs and regulations, or tax returns, beauty pageants and birther questions.


After the debate there were many sources that took online polls to determine who won the election.  A majority of them determined that Trump was able to win the debate.  Now these are not exactly scientific, and it might be a little while until more polls come out about the debate, but I think this shows two things: Trump did a lot better than expected and he definitely didn’t lose any voters.


Now there are two polls that I want to talk about specifically.  The CNN poll and the Drudge Poll.   The Drudge report is the leader in news aggregation, has a strong following, and been determined to be one of the media outlets that will have an impact on this election.  On his poll of the Debate, he had 500,000 votes and said that Trump won with 82%. Now a lot of visitors on his site tend to lean to the right, it still shows tremendous support for Trump.  Now the same thing can be said for CNN’s poll, which leans left and determined that Clinton won with 62%, but only asked 521 people.  47% said it would not affect their vote, 34% said it moved them towards Clinton and 18% towards Trump.  I think that the first debate, because of its biased questioning that helped Clinton put Trump on the defensive, didn’t anything to lose voters, but didn’t really sway any voters wither.


Now a very interesting determinant for the election has been the Mexican peso.  Investors clearly thought Clinton won and the peso shot up 1.5% against the dollar on Tuesday.  This will be a good forecasting tool to look at for the election in the coming months.


The 2012 Cycle


In October 2012, there were three key Presidential debates between Barack Obama and Mitt Romney. These debates fell on the days of October 3rd, 16th, and 22nd. By analyzing several different polls, I hope to illustrate that the 2012 Presidential debates had an influence over the 2012 Presidential election.


The image below comes from a site called Real Clear Politics. The data is a weighted average of various different poll results. The highest margin of error is 4% and the lowest sample size is roughly 800 people. Therefore, they are fairly strong sample sizes from the shallowest analysis. This data draws from sites such as CBS, FOX News, Wall St. Journal, Politico, and various other noteworthy sources. As a side comment, I am unsure how the weight is applied to specific sources, so there might be some bias in that sense.


From the line graph below, one can see that the spread between Obama and Romney support before the first Presidential debate is quite high at almost 4%. However, as the first debate came to a close. One can clearly notice a distinct increase in Romney and decrease in Obama’s voter breakdown. If you recall, in this debate there was a clear and decisive winner. That winner was Mitt Romney, the polls reacted accordingly. In their second debate, there was not a clear winner, this also can be seen in the polls as very little change occurs. With the debate results and the change in polling results in mind, I believe it is possible to make an educated prediction of the Presidential election outcome based off of debates.

picture1

The 2008 Cycle


During the 2008 election cycle, Barack Obama and John McCain faced off in three televised presidential debates, with the first being held on September 26th at the University of Mississippi by PBS. While the original plan was for more of a foreign policy debate, half was dedicated to the economy in light of the recent financial crisis. Ultimately, most polls ended up pointing to an Obama win: Talking Points Memo’s poll (via CNN) gave Obama a 51-38 victory over McCain, and a CBS poll gave it to Obama with a 39-24 spread (with the rest being undecided). Nate Silver attributed the first night’s victory to Obama’s speaking to middle class voters, something the transcript could not find for his opponent.


But did this create an actual difference in the horse race? Specific causes can be hard to tease out of noisy polling data, as presidential elections are chaotic systems. However, if a clear gap were to quickly emerge between the candidates after the late September debate, it would be easy to point to the debate as the cause, as long as there weren’t any other major events around that time that would interfere.


As in Charles’ coverage of 2012, Real Clear Politics provides good historical data to this end. Their information from August until the election is reproduced below, with a line at the date of the first debate:


picture2

The data proves unconvincing. There is a small McCain drop around September 26th, but one that he regains just days later. Additionally, FiveThirtyEight’s polling experts enjoy emphasizing that polling lags behind current events by around five days. Even after that wait, there is no spike in either candidate’s numbers. Obama does slowly gain on the +4.2 spread he held on the night of the debate, but not quickly enough to attribute it to his debate success alone.


Ultimately, it is unclear how linked debate performance and polling success are. The two seem to move together in 2012, but the correlation is lost in 2008. Debate performance may be a useful tool in predicting elections, but more research with more debates going farther back is needed to make any solid conclusions.